Created by Marisa Ruiz Asari
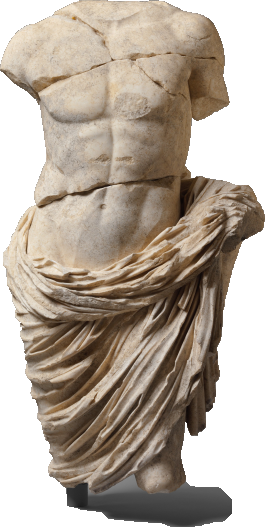
The Metropolitan Museum of Art has made nearly 500,000 pieces of art publicly available through its online collection. Anyone with access to a browser can now view the collection’s images virtually. However, when we view these images in a virtual space, we lose the sense of scale we get when we visit the museum in person. This visualization explores a subset of the Met’s online collection in which scale plays a large role in the viewer experience: sculptures of human subjects.
This visualization was created as part of the Masters in Data Visualization Major Studio 1 course at Parsons School of Design. Data and images are sourced from the Met API. Over the course of the Fall 2019 semester, I worked with the Met's open access data to explore the concept of scale in virtual space. The visualizations focus on sculptures of human subjects, and explore various ways of depicting relative scale. The semester was broken into four units: 1. Quantitative Data, 2. Qualitative data, 3. Interactivity, and 4. New Contexts.
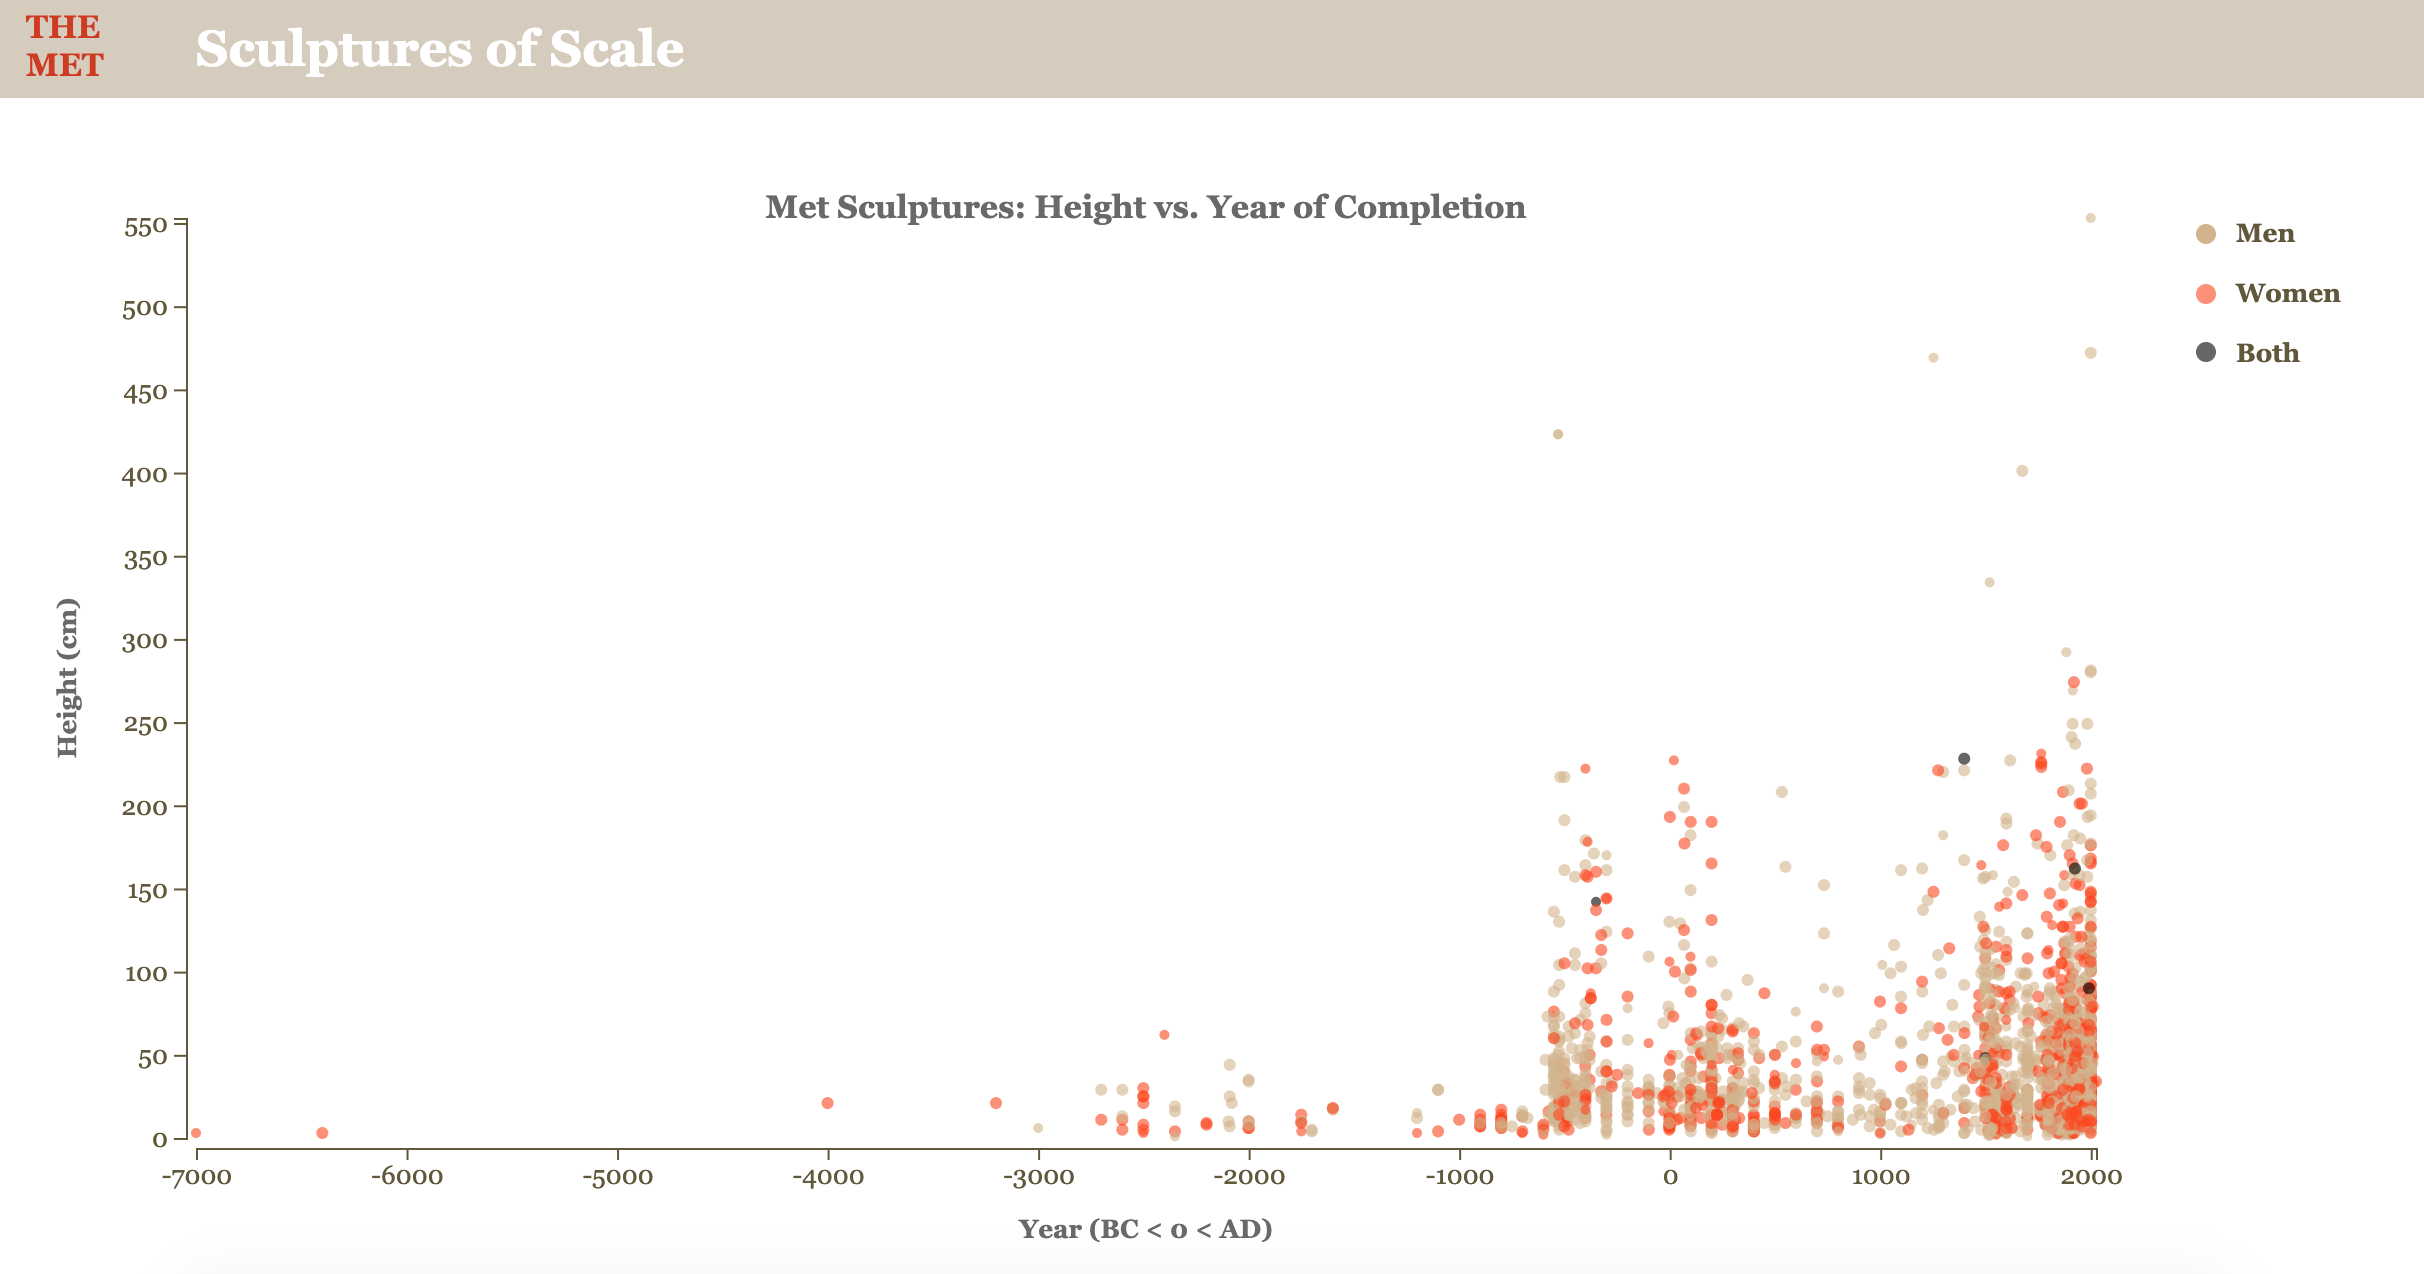
1. Quantitative Visualization: Gender and Height
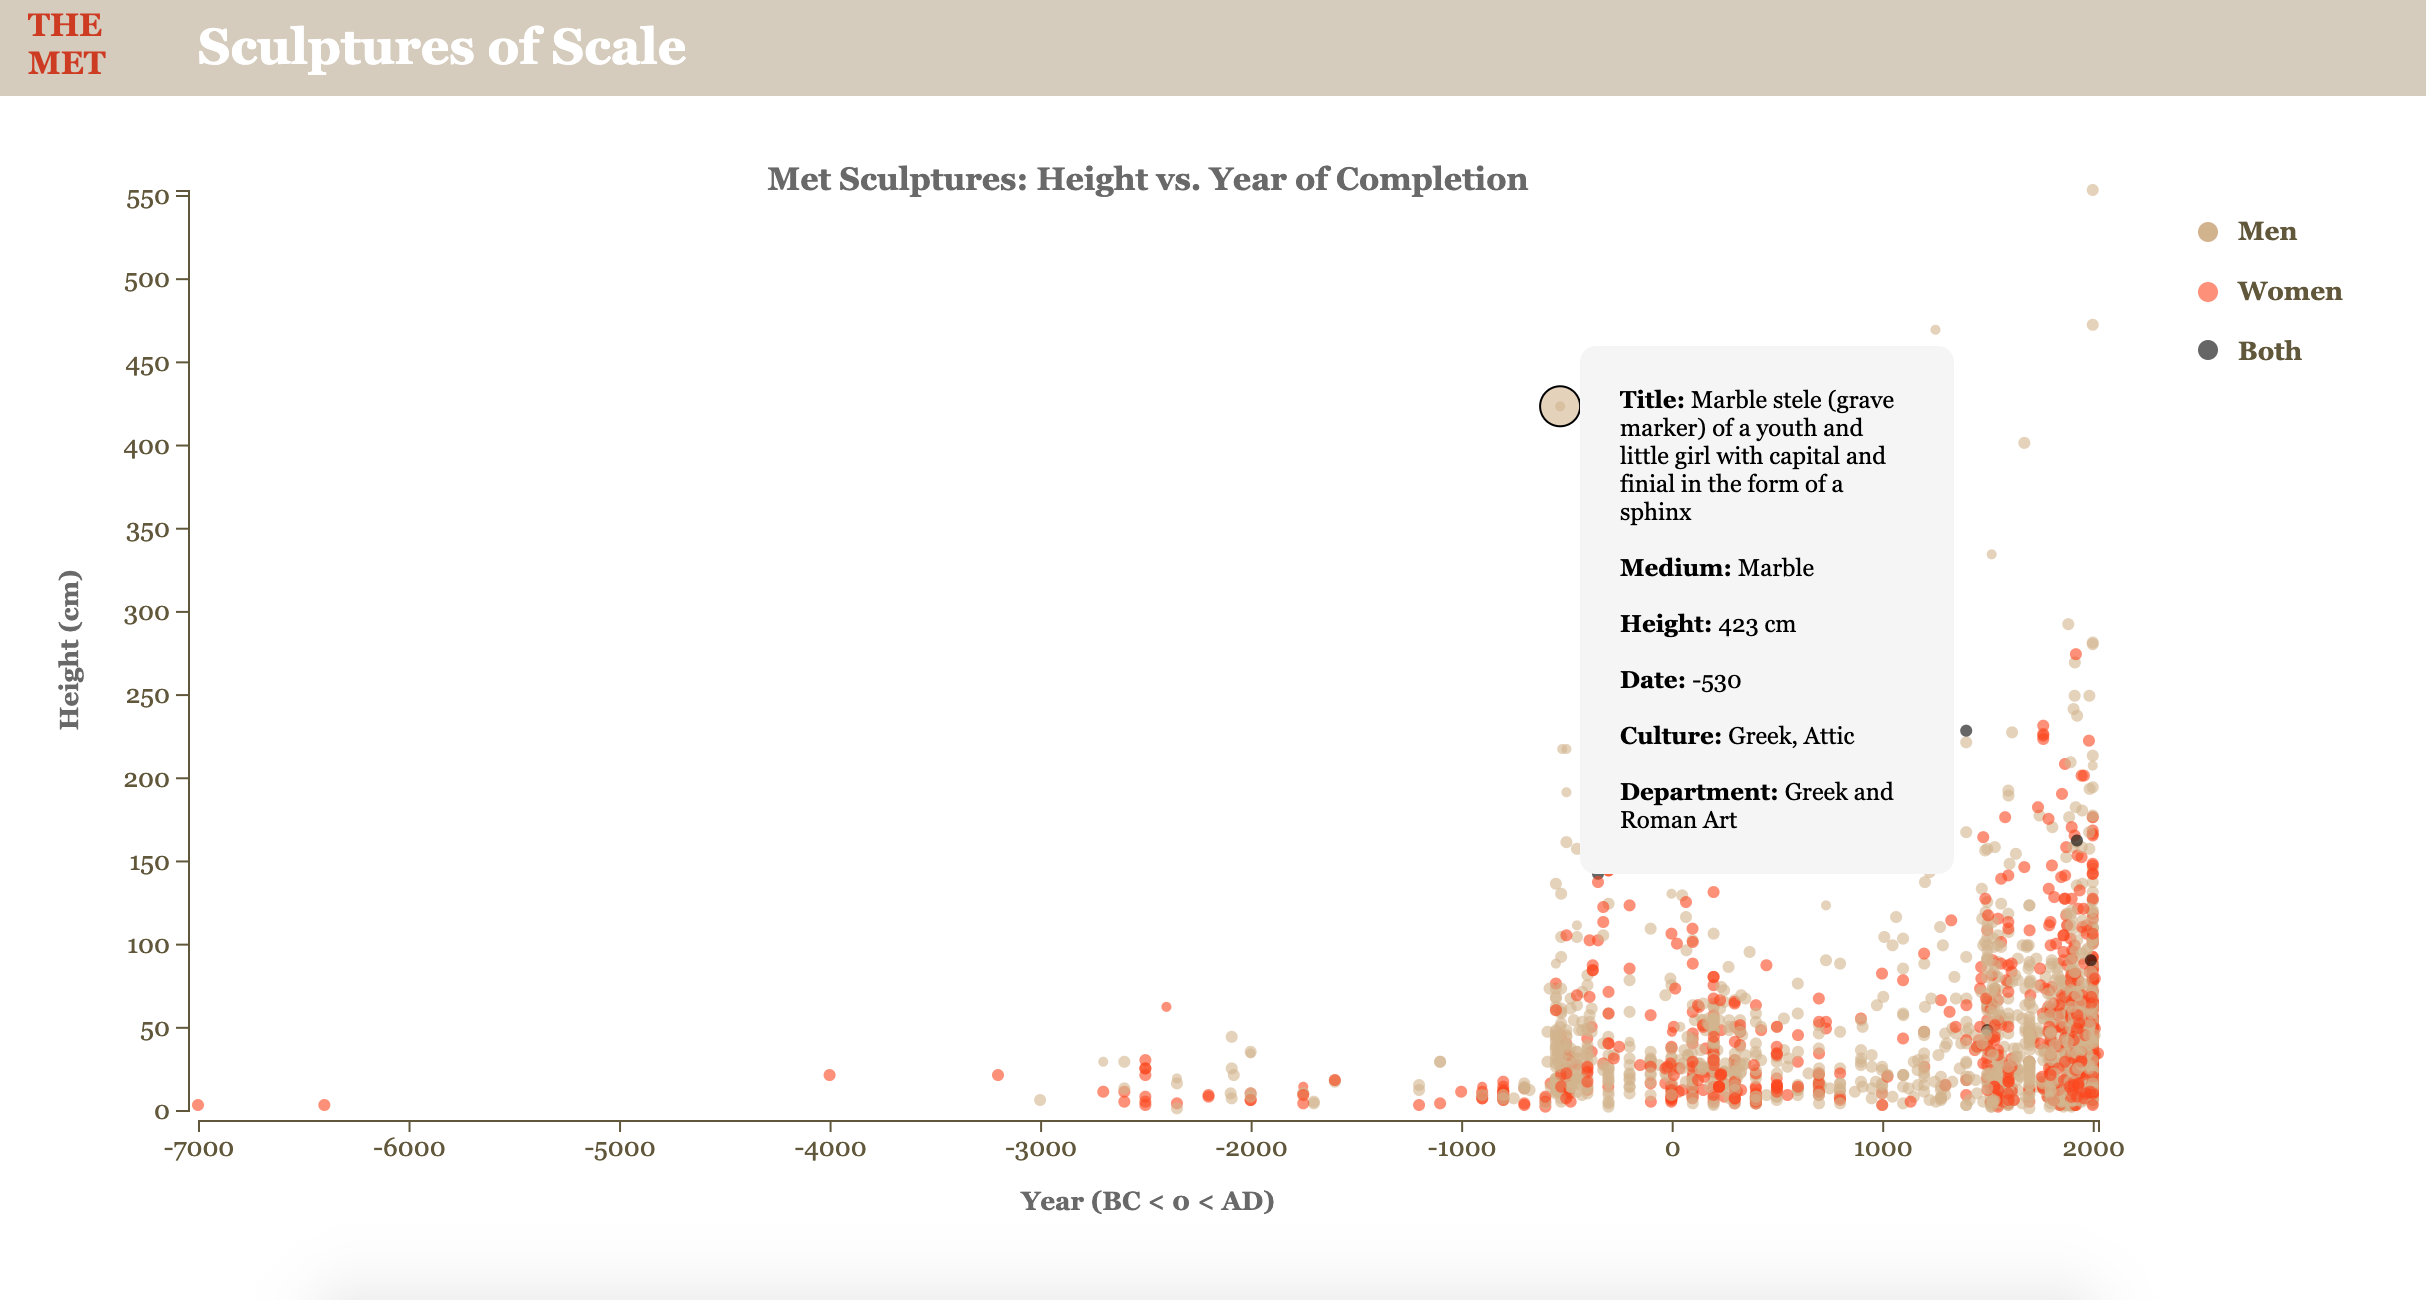
Here I plotted sculpture height vs year of creation, separating scuptures by gender tag. This visualization revealed that the tallest sculptures in the online collection were tagged as male, and that the oldest sculputres tend to be smaller than those more recently created.
Visualization Screenshots
2. Qualitative Visualization: Sculptures of Scale Iteration One
For the first iteration of Sculptures of Scale, I divided the sculptures into three categories: small, medium, and large. The visualization allows users to loop through each category, with the primary view being unscaled (the width of sculpture images held constant). The second scaled view allows user to compare the relative heights of the sculptures.
Iteration one mockup
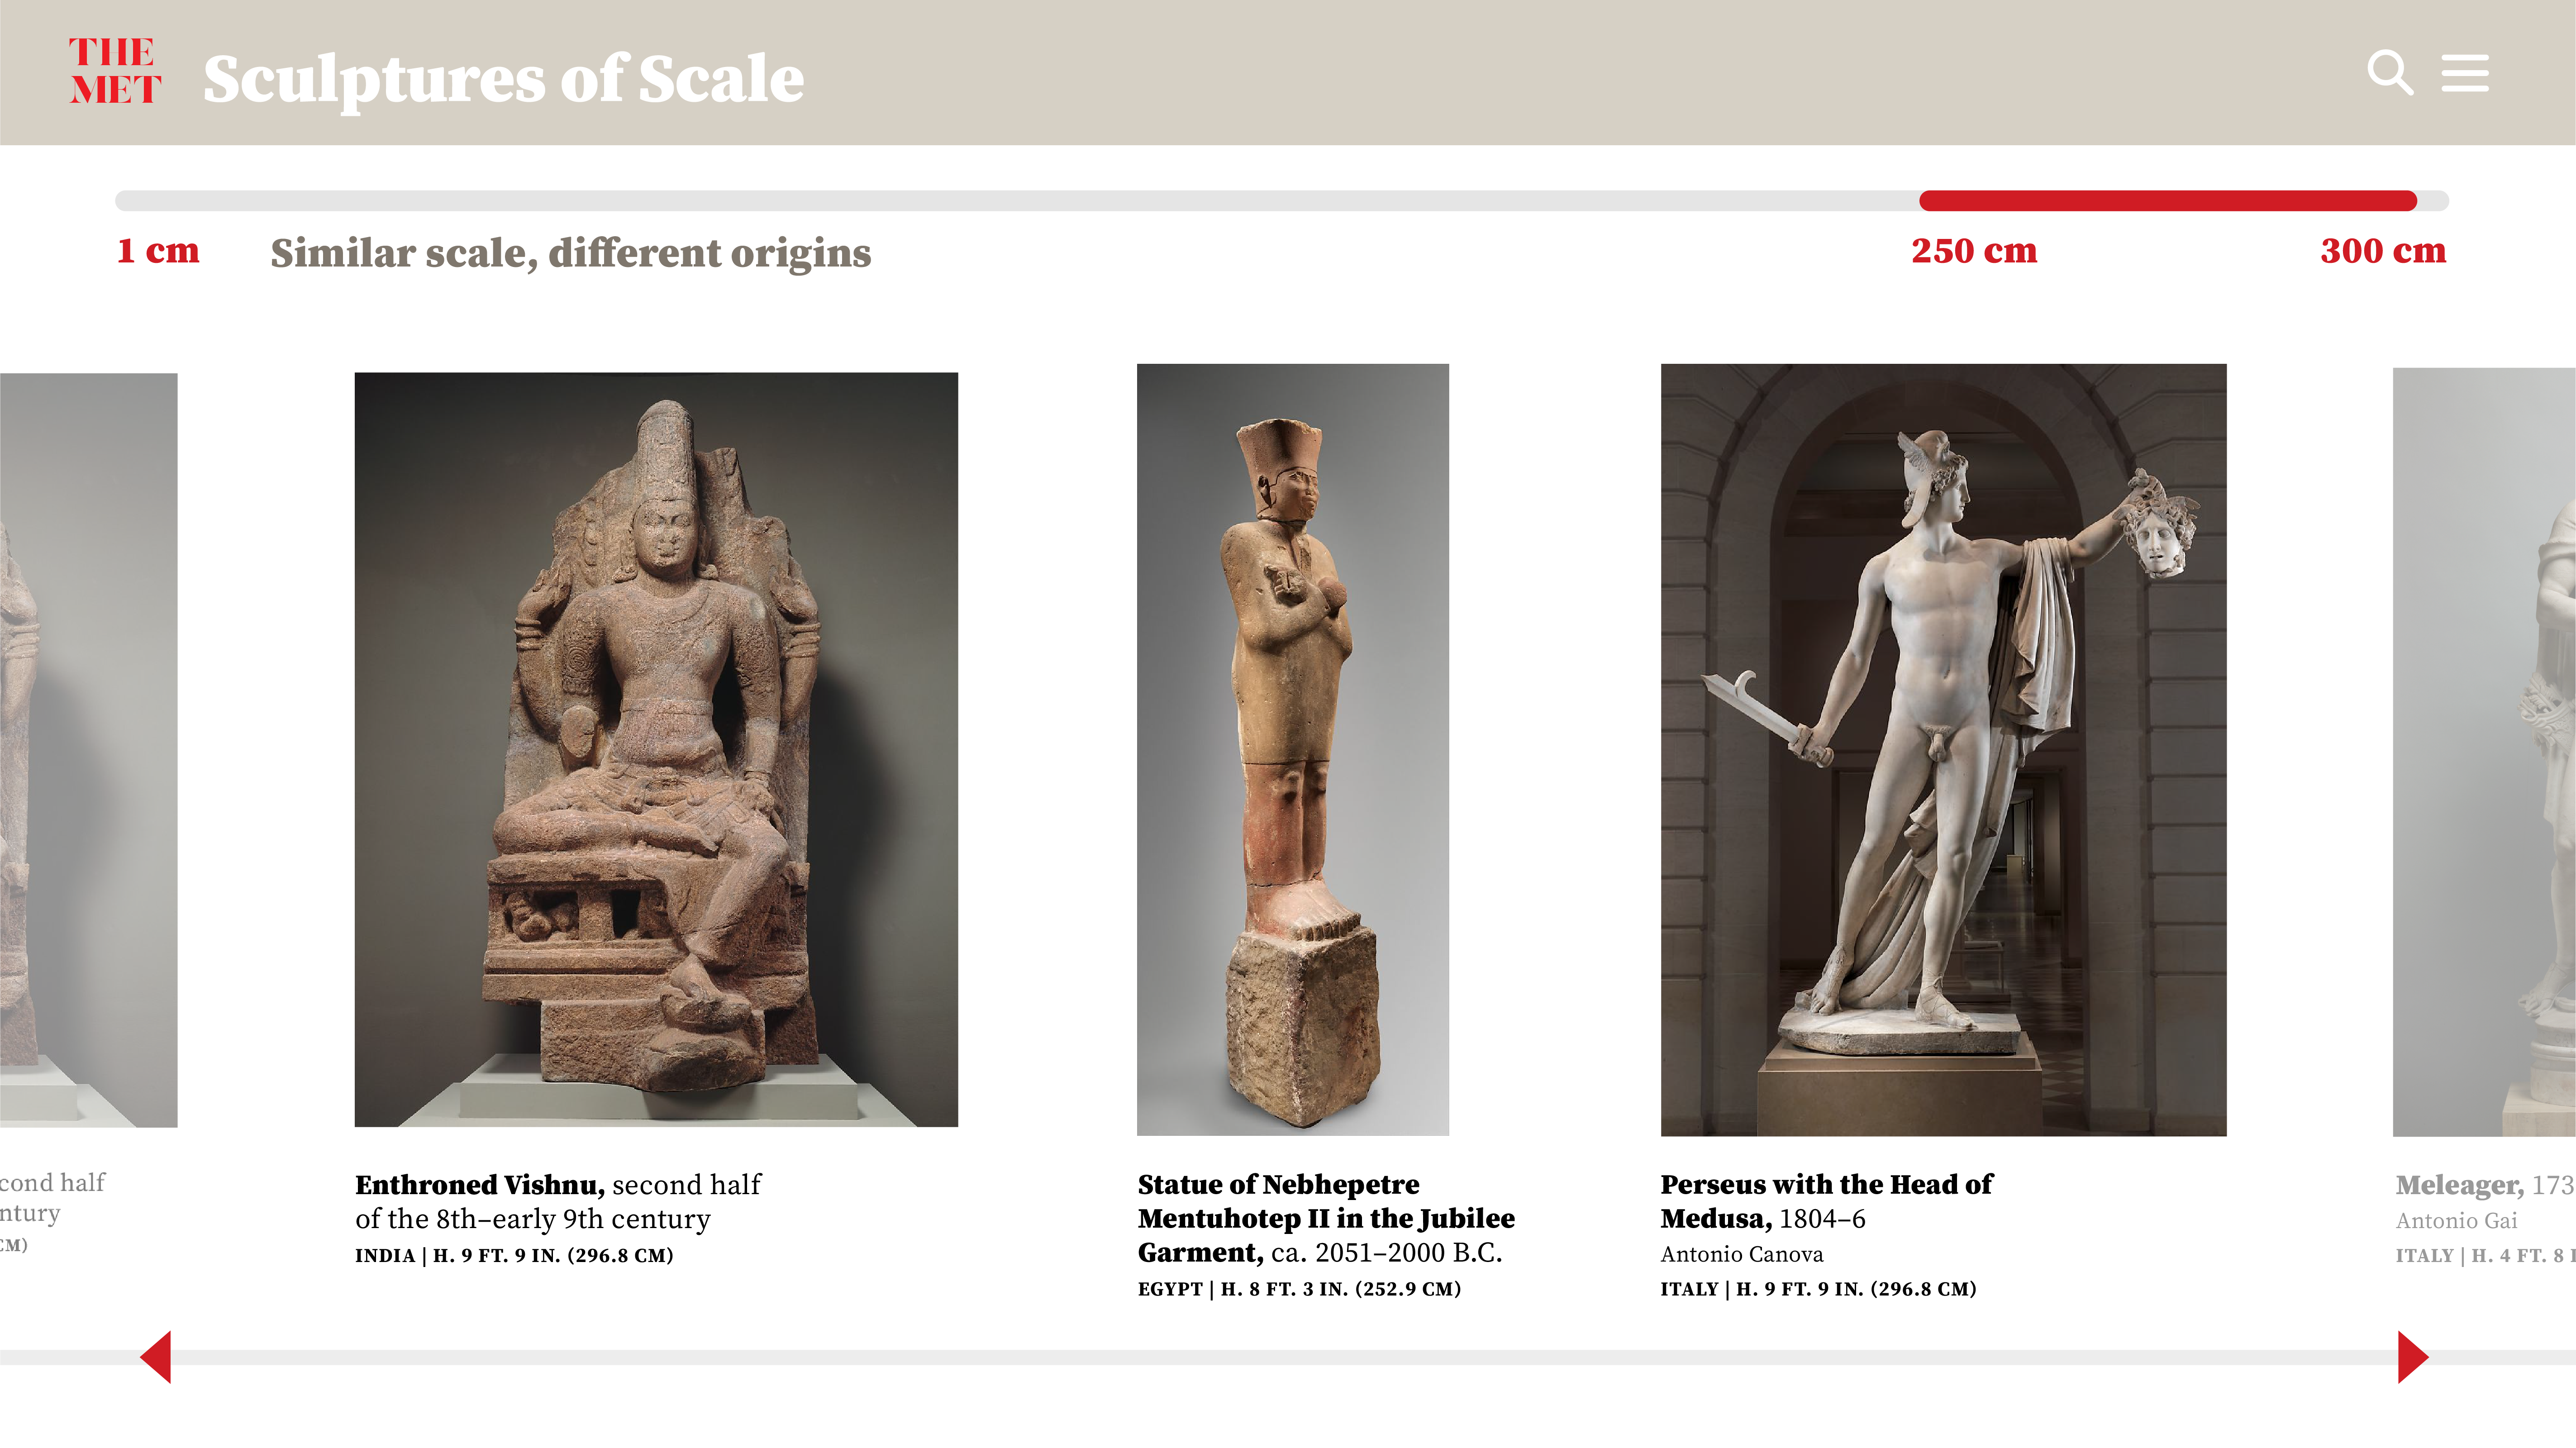
Iteration one visualization
3. Interactivity: Sculptures of Scale Iteration Two
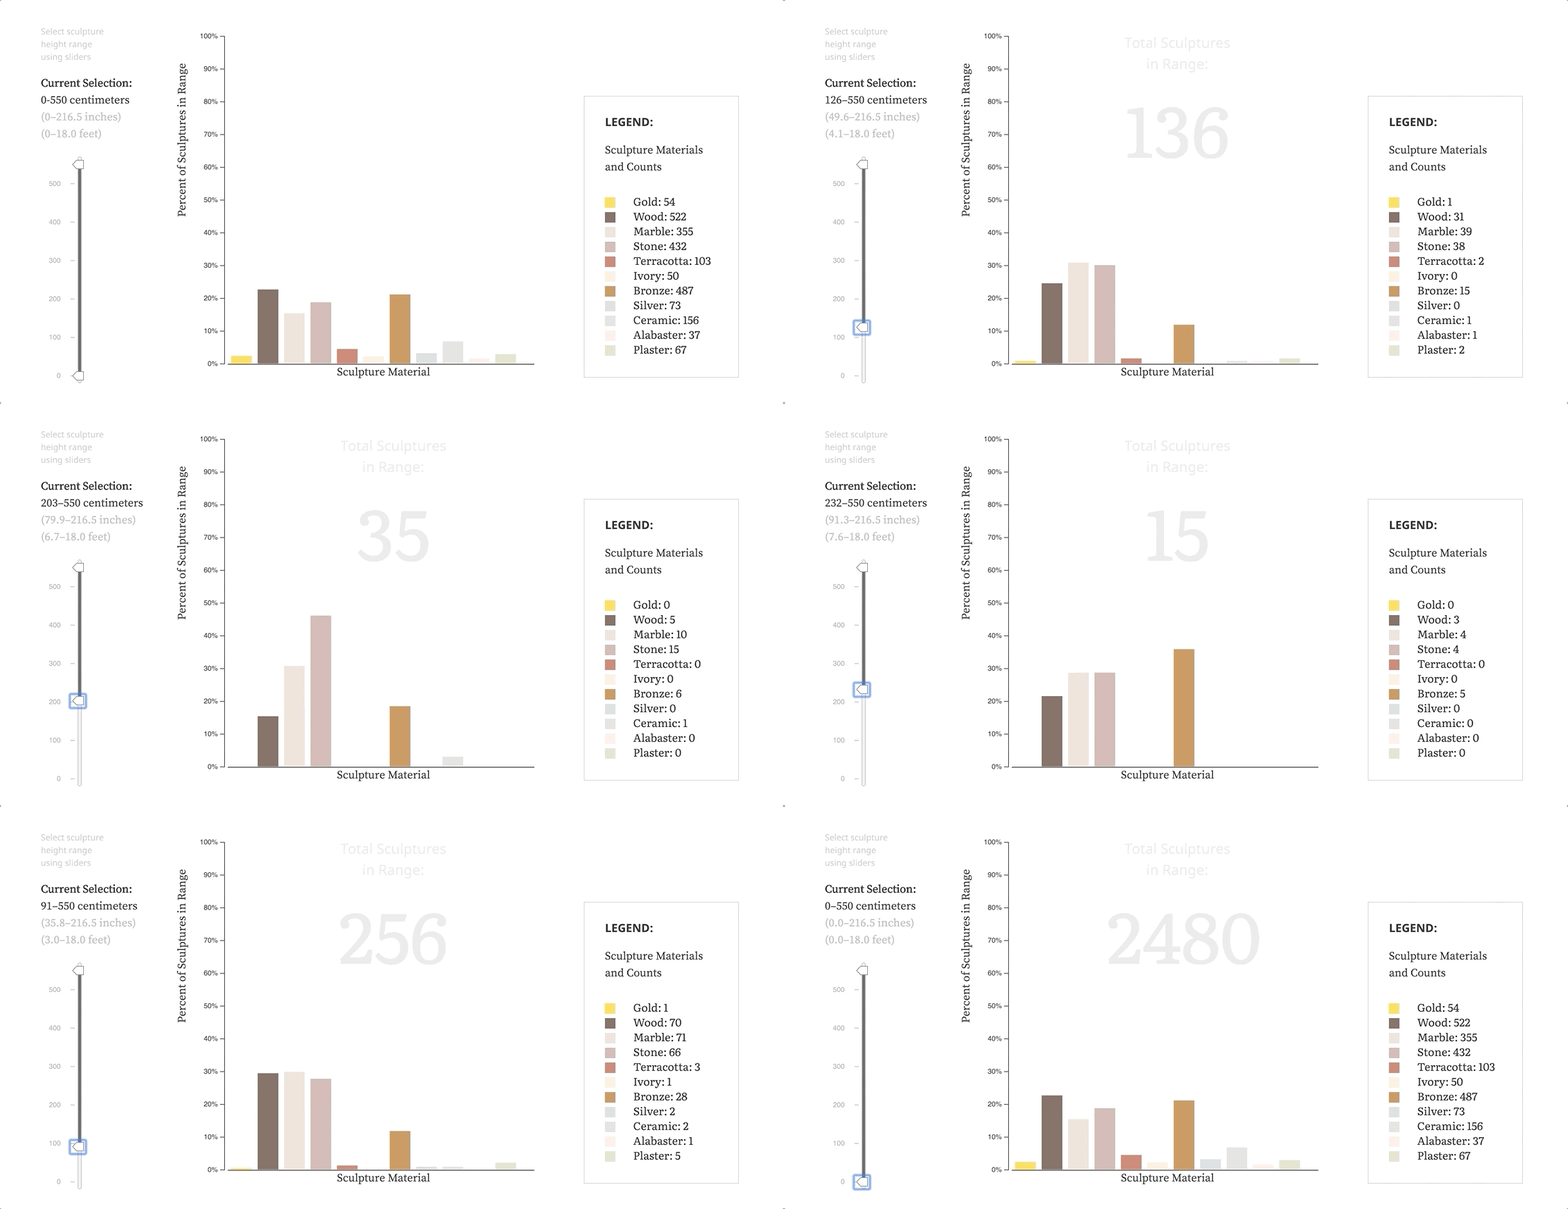
For the second iteration of Sculptures of Scale, I wanted to combine both quantitative and qualitative visualization methods. I started with an interactive bar chart created in D3, with a range slider for filtering sculpture height using the d3-simple-slider library. In this version of the visualization, users can click on the individual bars to view images of sculptures within their selected height range and material. Users can then select up to three sculptures to compare relative heights.
Iteration two mockup
Iteration two visualization
4. New Contexts: Sculptures of Scale Final
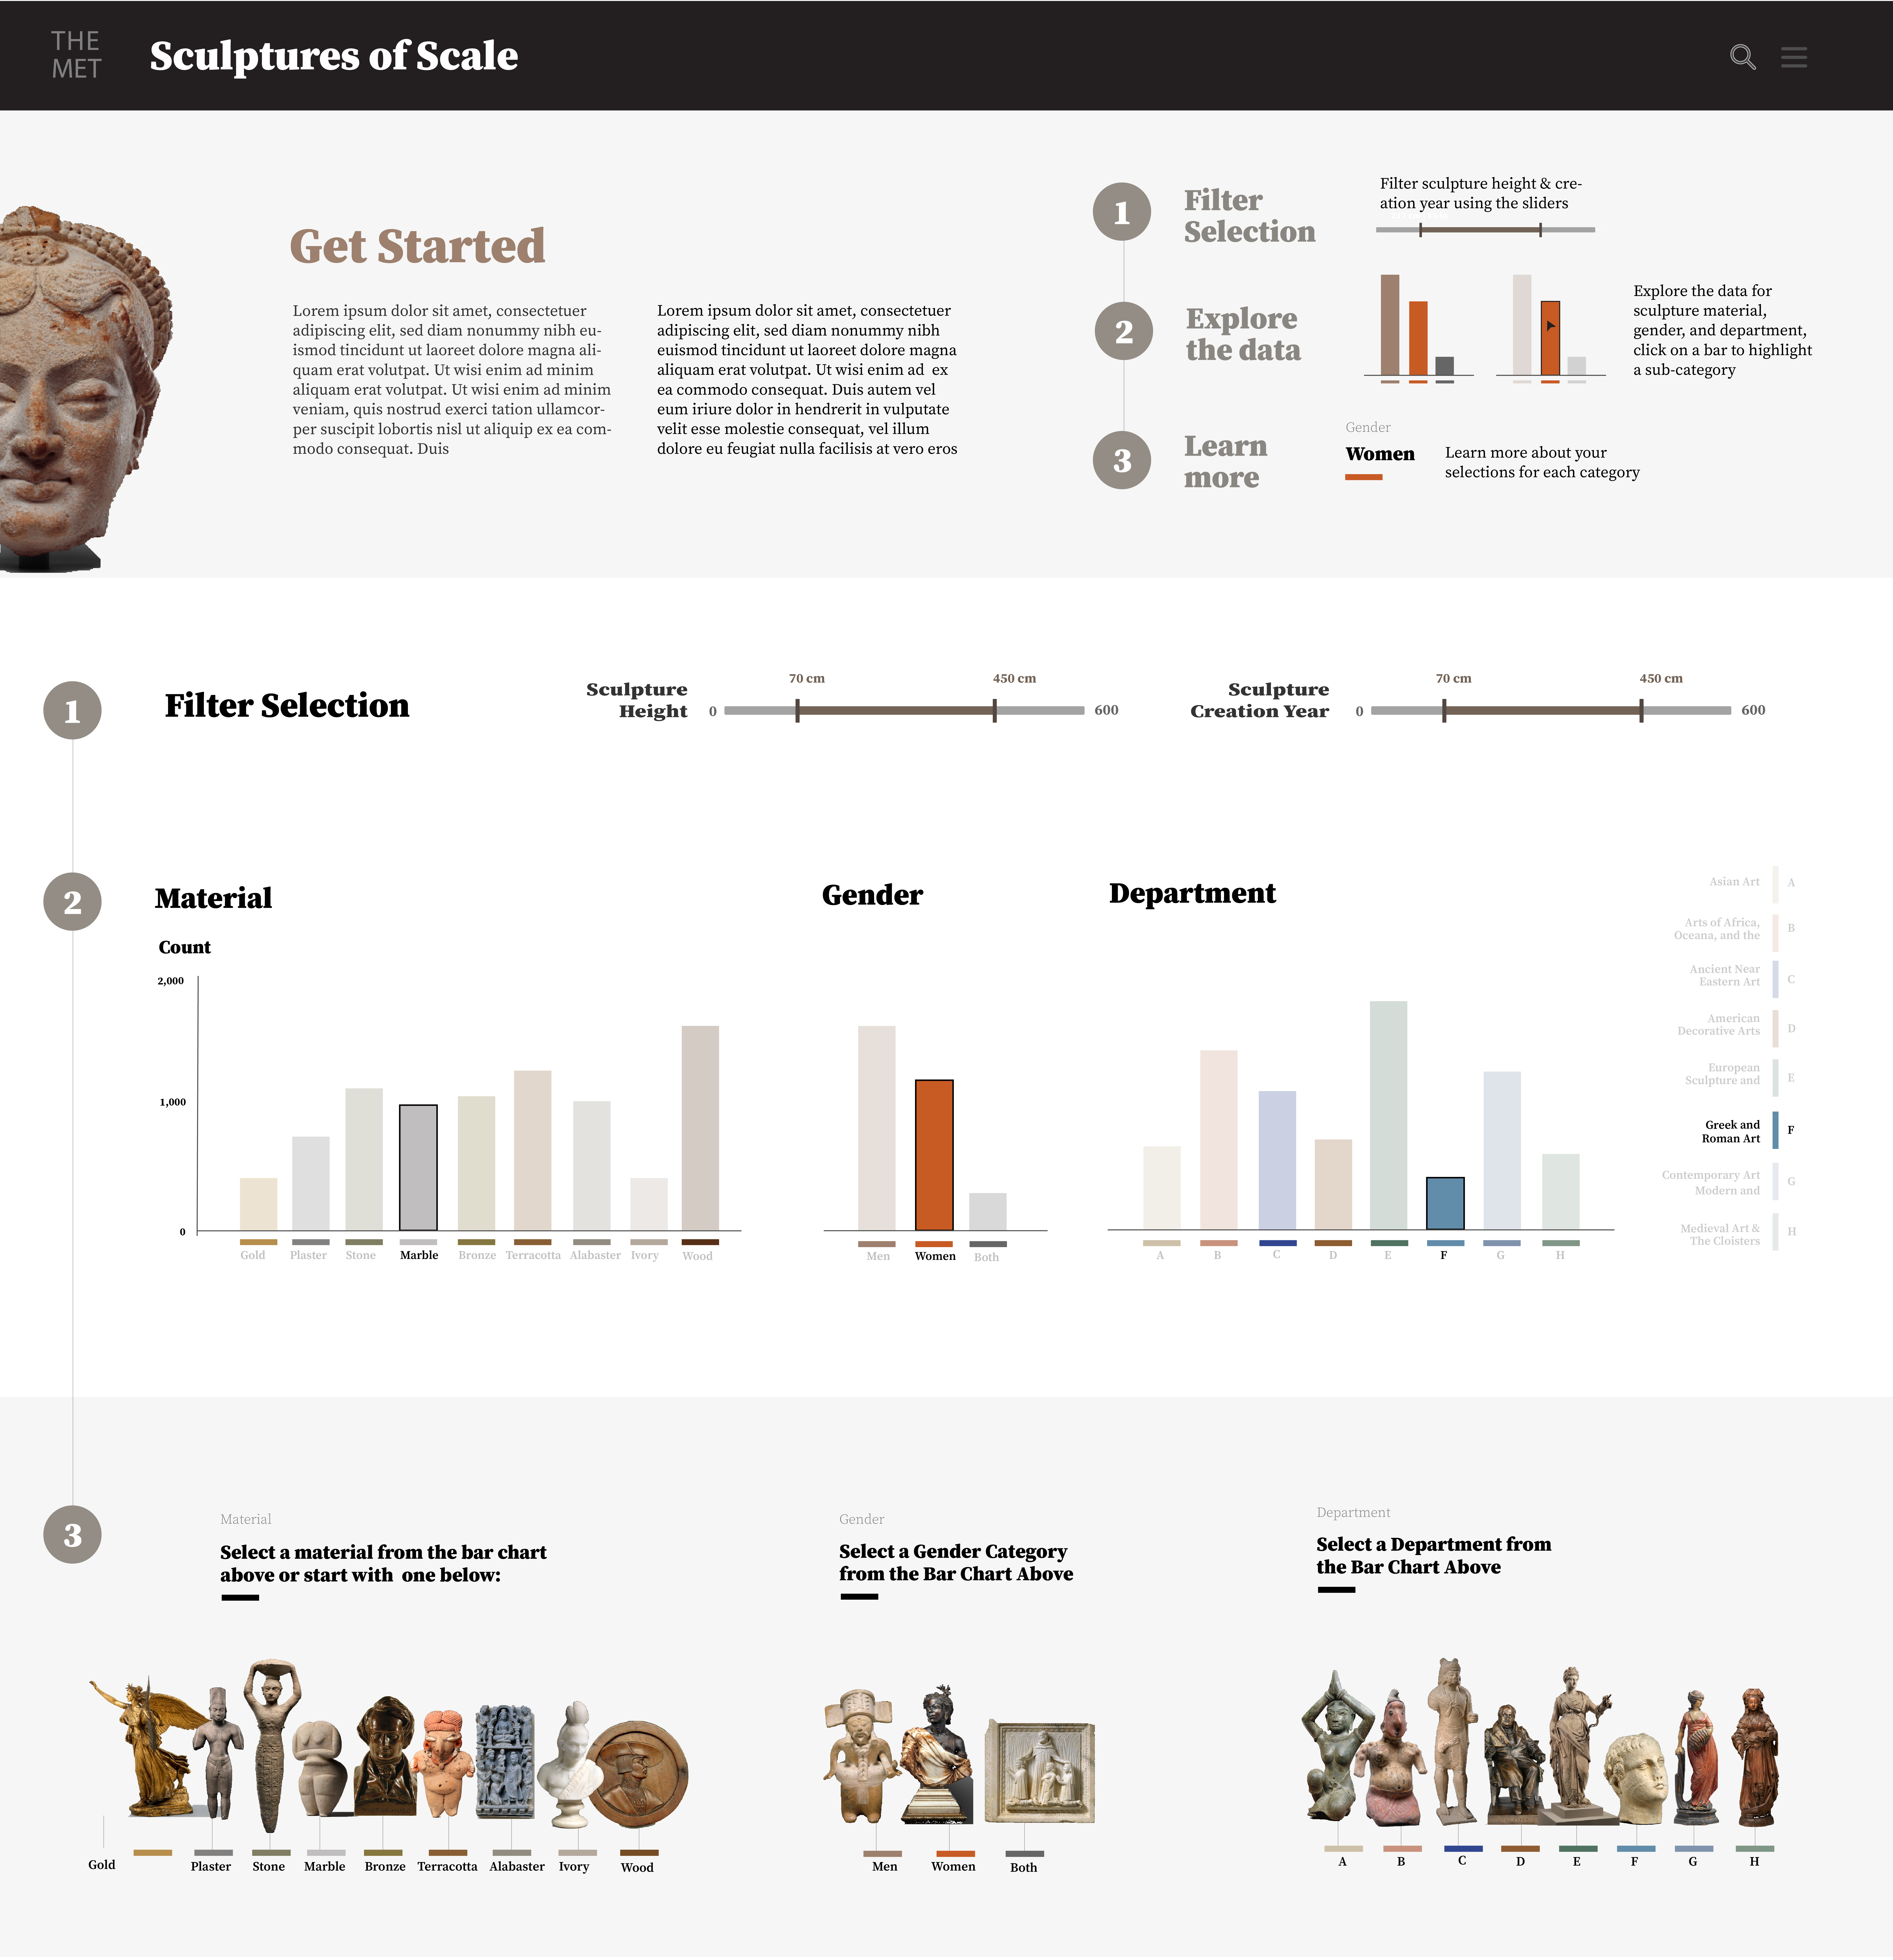
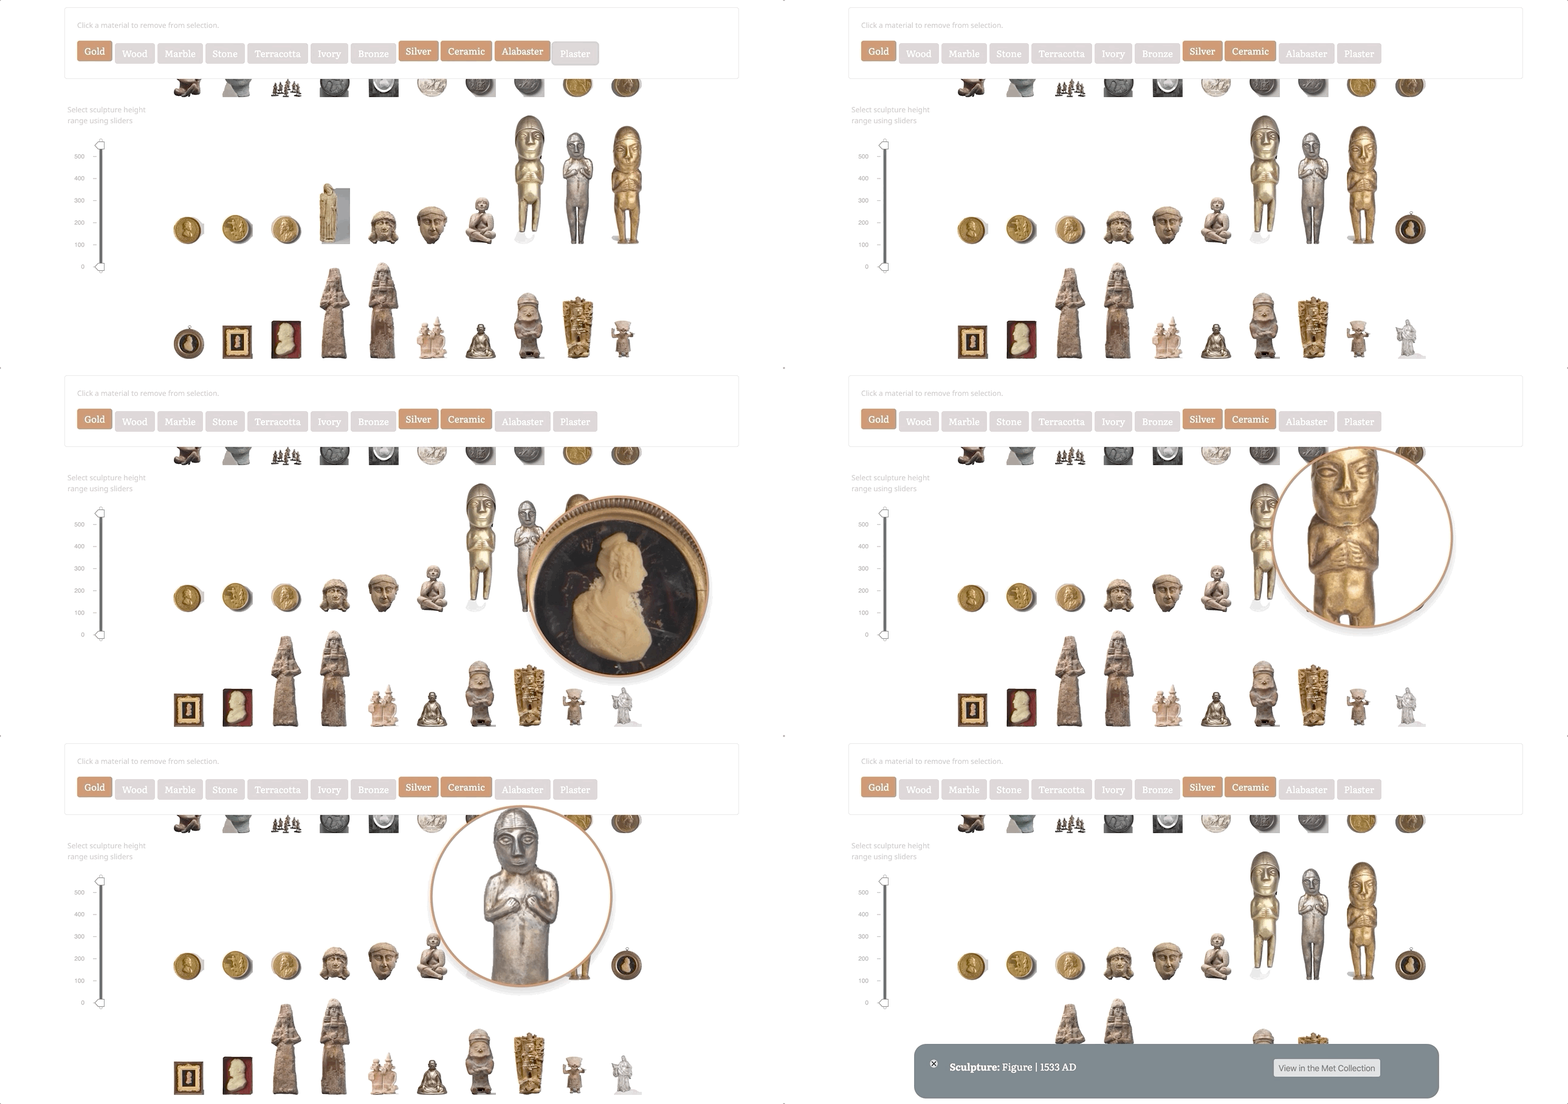
In the final iteration of Sculptures of Scale, I expanded upon the interactive unit to create a full website for multiple visualizations and exploratory tools. Here I decided to break up the interactivity into three separate components: 1. Quantitative insights, 2. All sculpture images filtered by height and material, and 3. Relative height comparison filtered by height and material.
While I was happy about the layered interactivity in the prior iterations, I decided that separating out the visualization into three components would simplify the user experience and allow for additional unguided exploration of the online collection using the available filters. Here I wanted users to be able to find their own insights and to think more about the idea of relative scale. The final focus here was adding a new way of scaling in the sculptures, and adding a constant object for comparison. For this component, users can select up to three sculptures for comparison, and each time a new sculpture is selected, all selected sculputres resale in relation to the largest sculpture in the selection. I also added a constant object for comparison based on the height of the tallest selected sculpture. For example, sculptures between 2.5-6 cm are compared to the height of a thumbtack, while sculptures between 25-75 cm are compared to a basketball.
Final Mockup 1
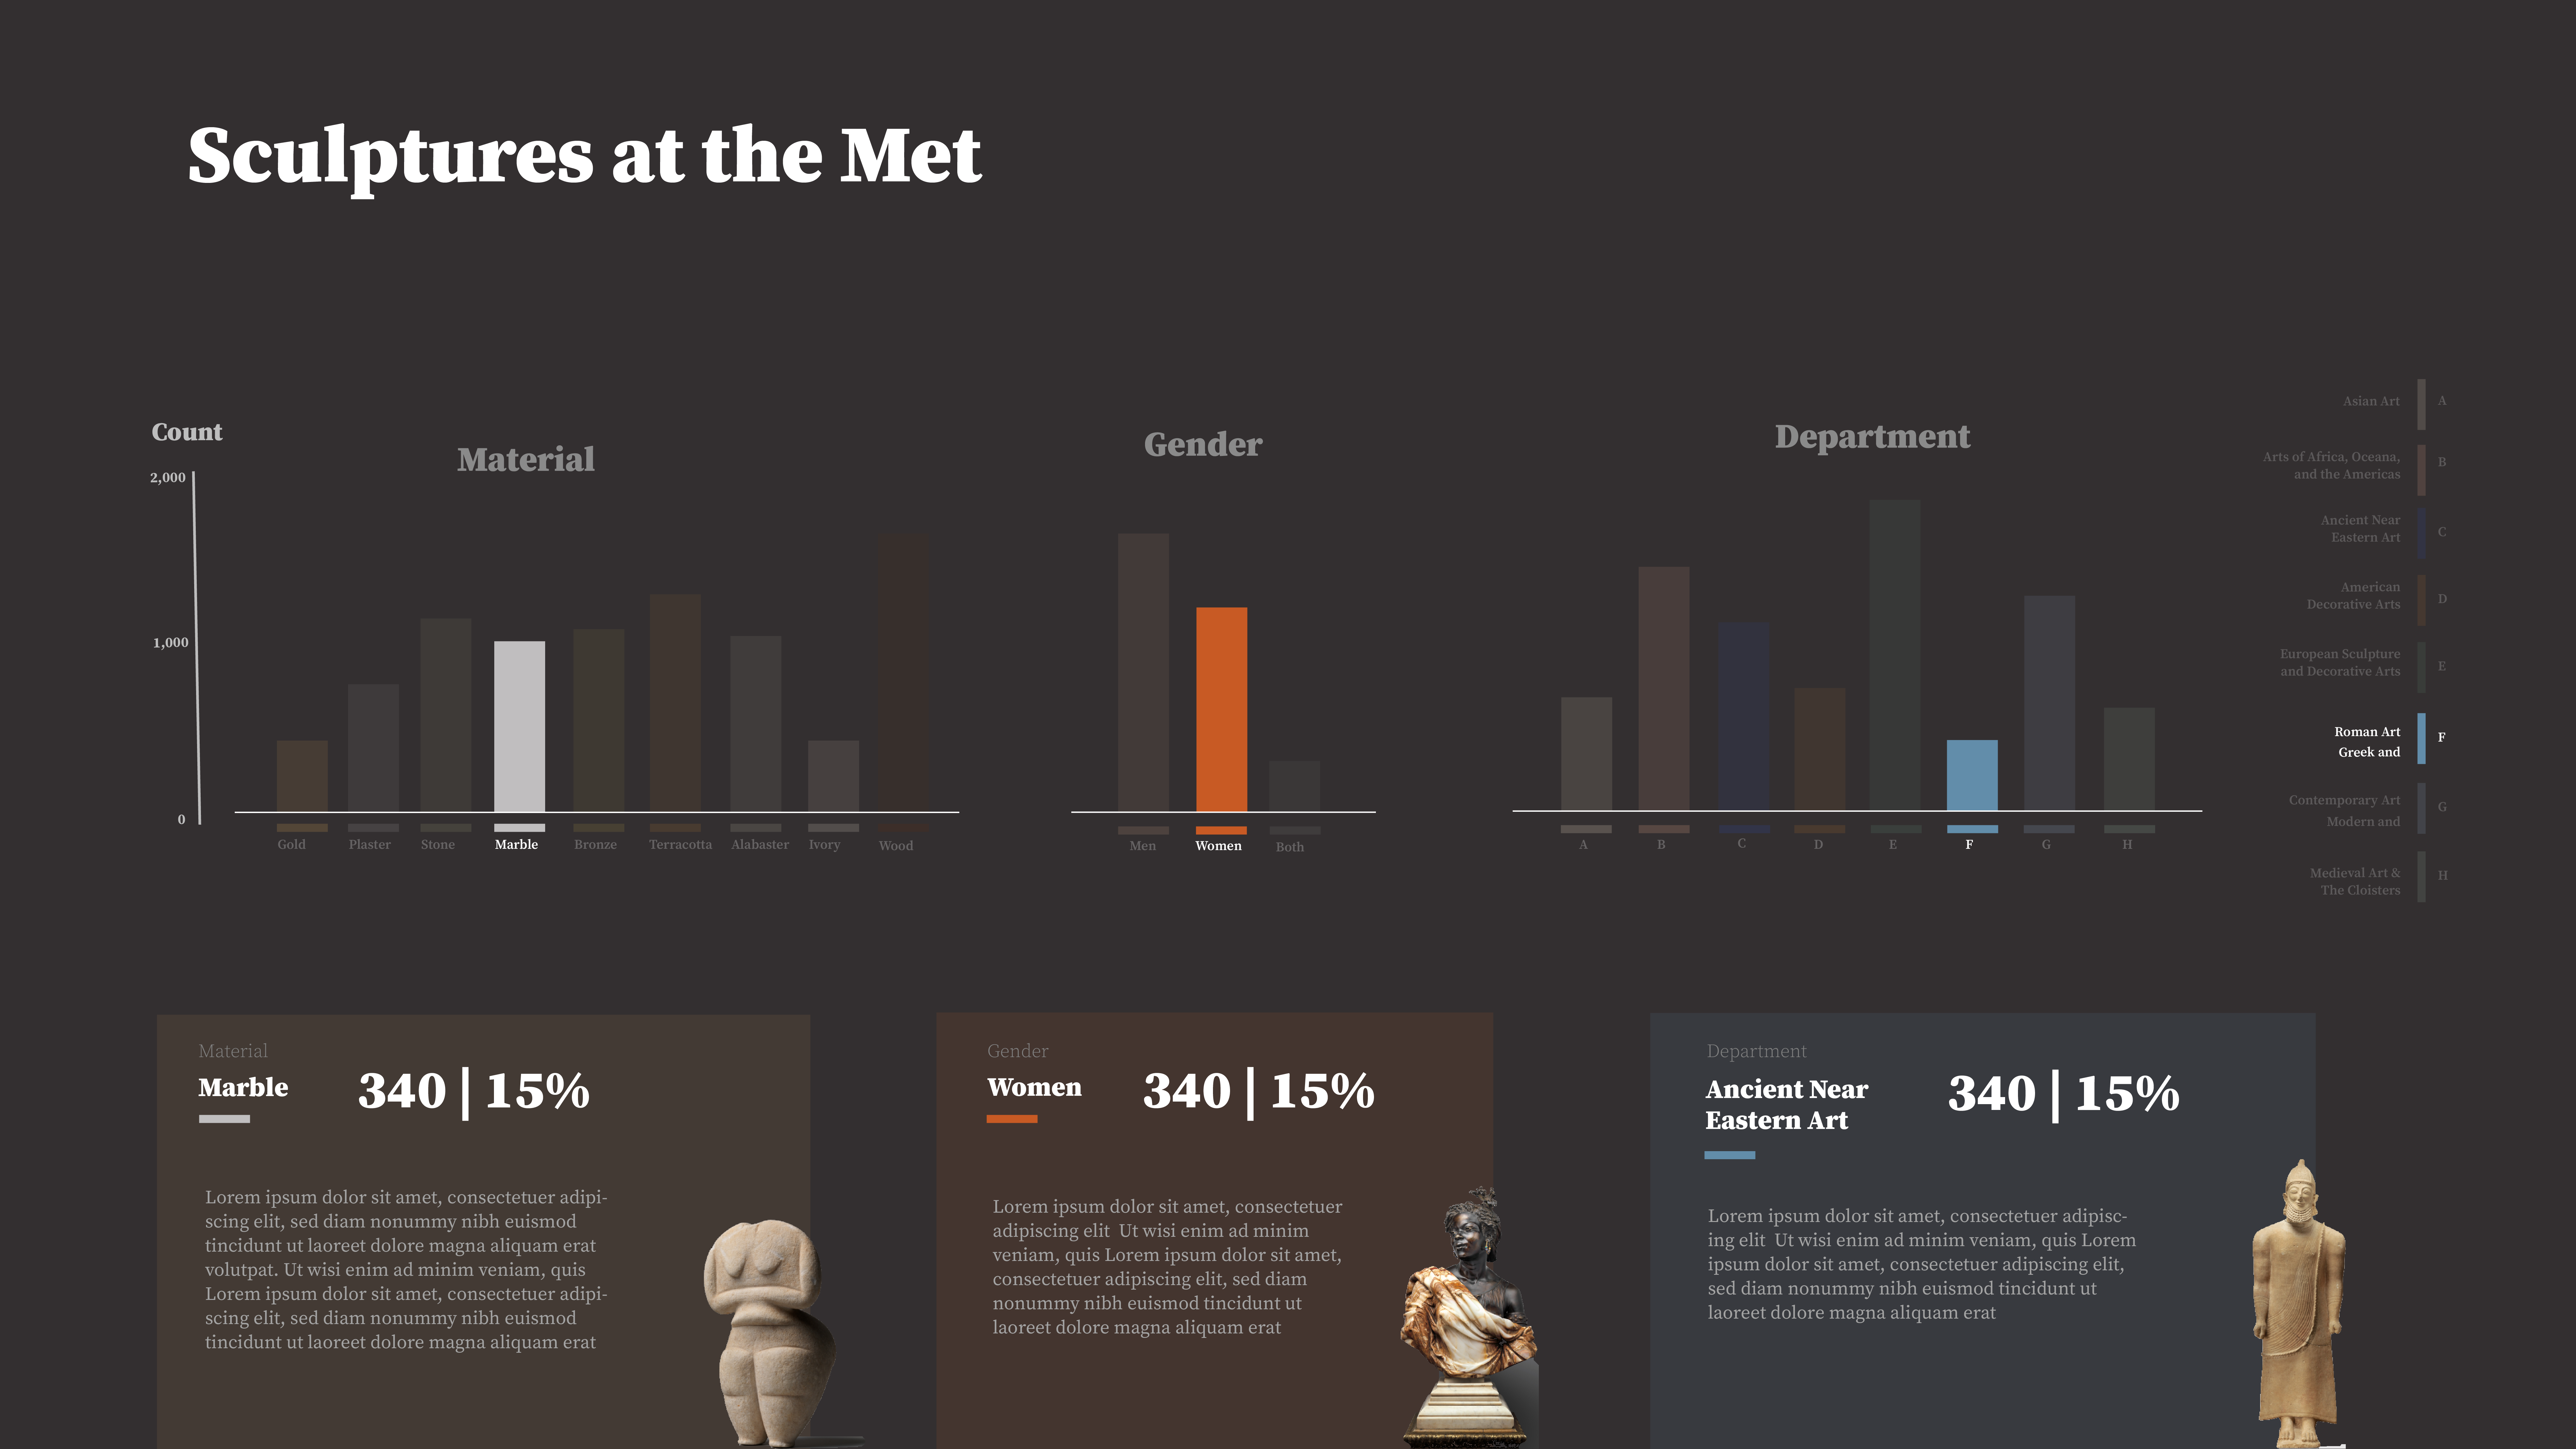
Final Insights Page
Final Images Page
Final Compare Page
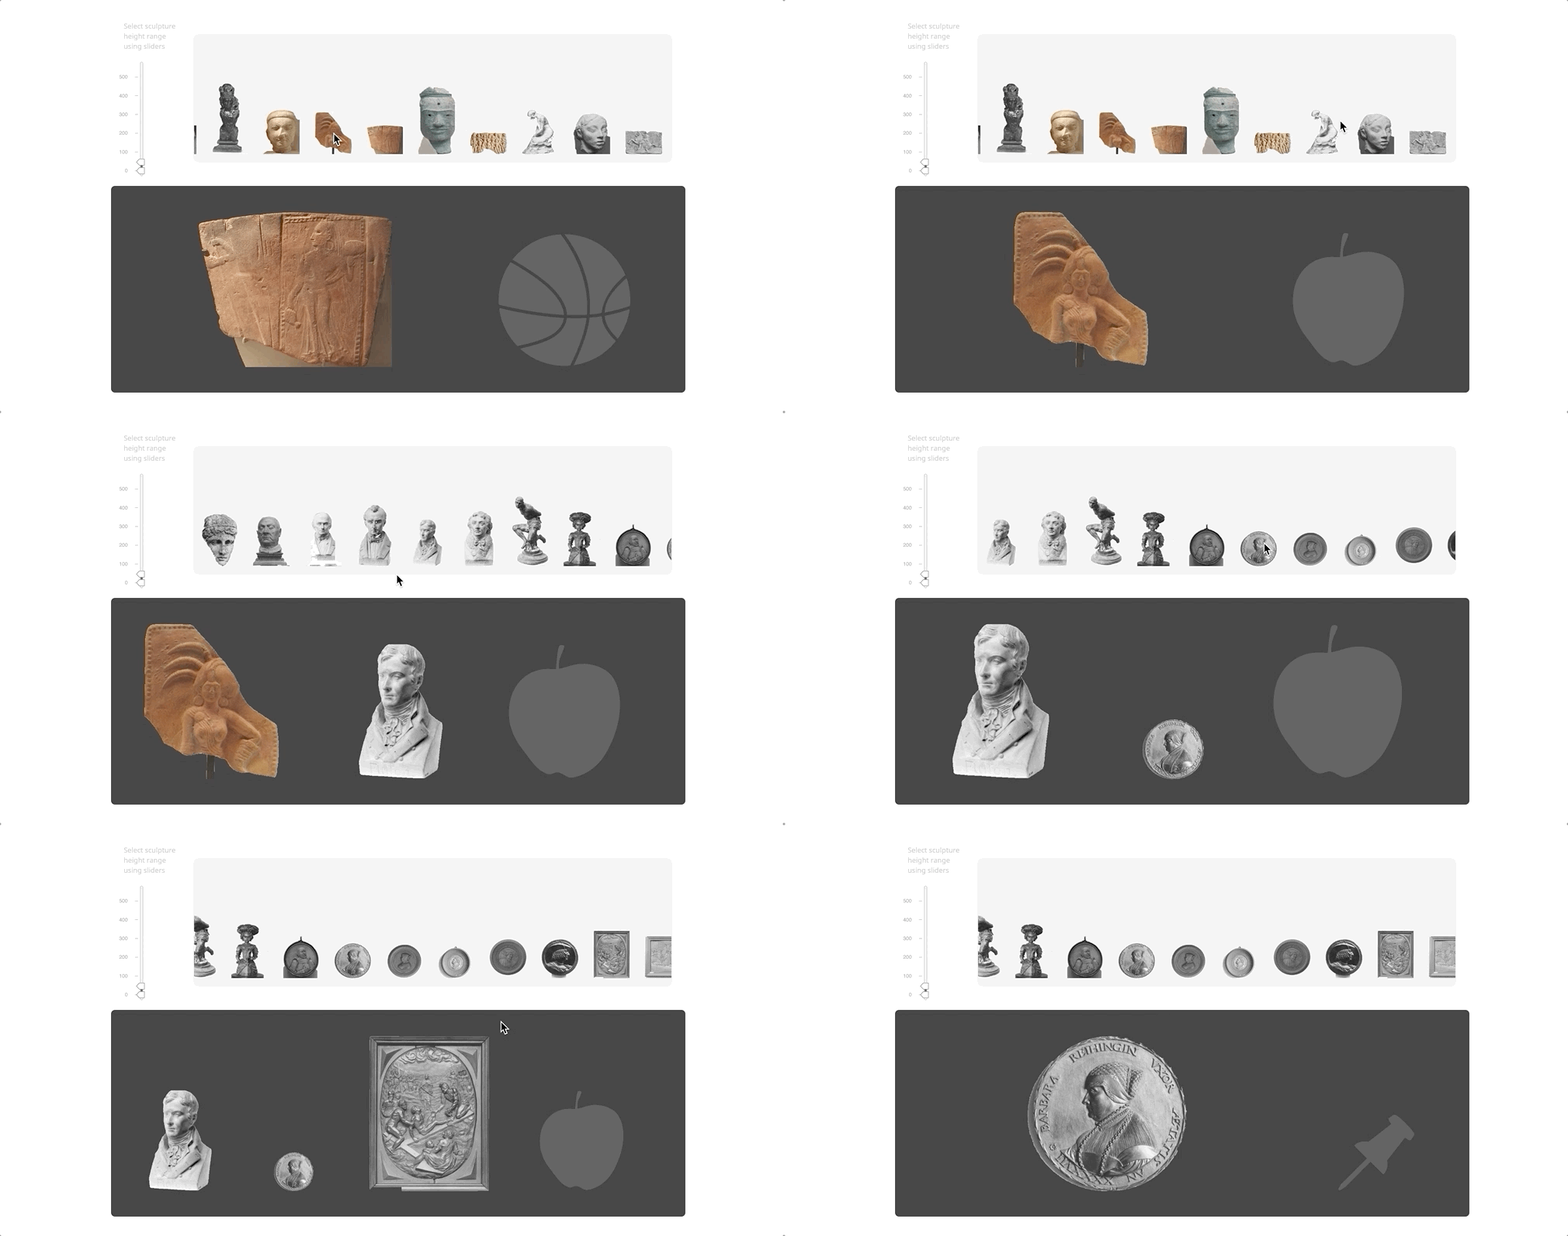
Final site walk through
4. New Contexts: Sculptures of Scale Iteration Mobile Version
In addition to the updated website, I added responsive mobile features that allow users to explore the site on a mobile or iPad device.
Mobile screenshots
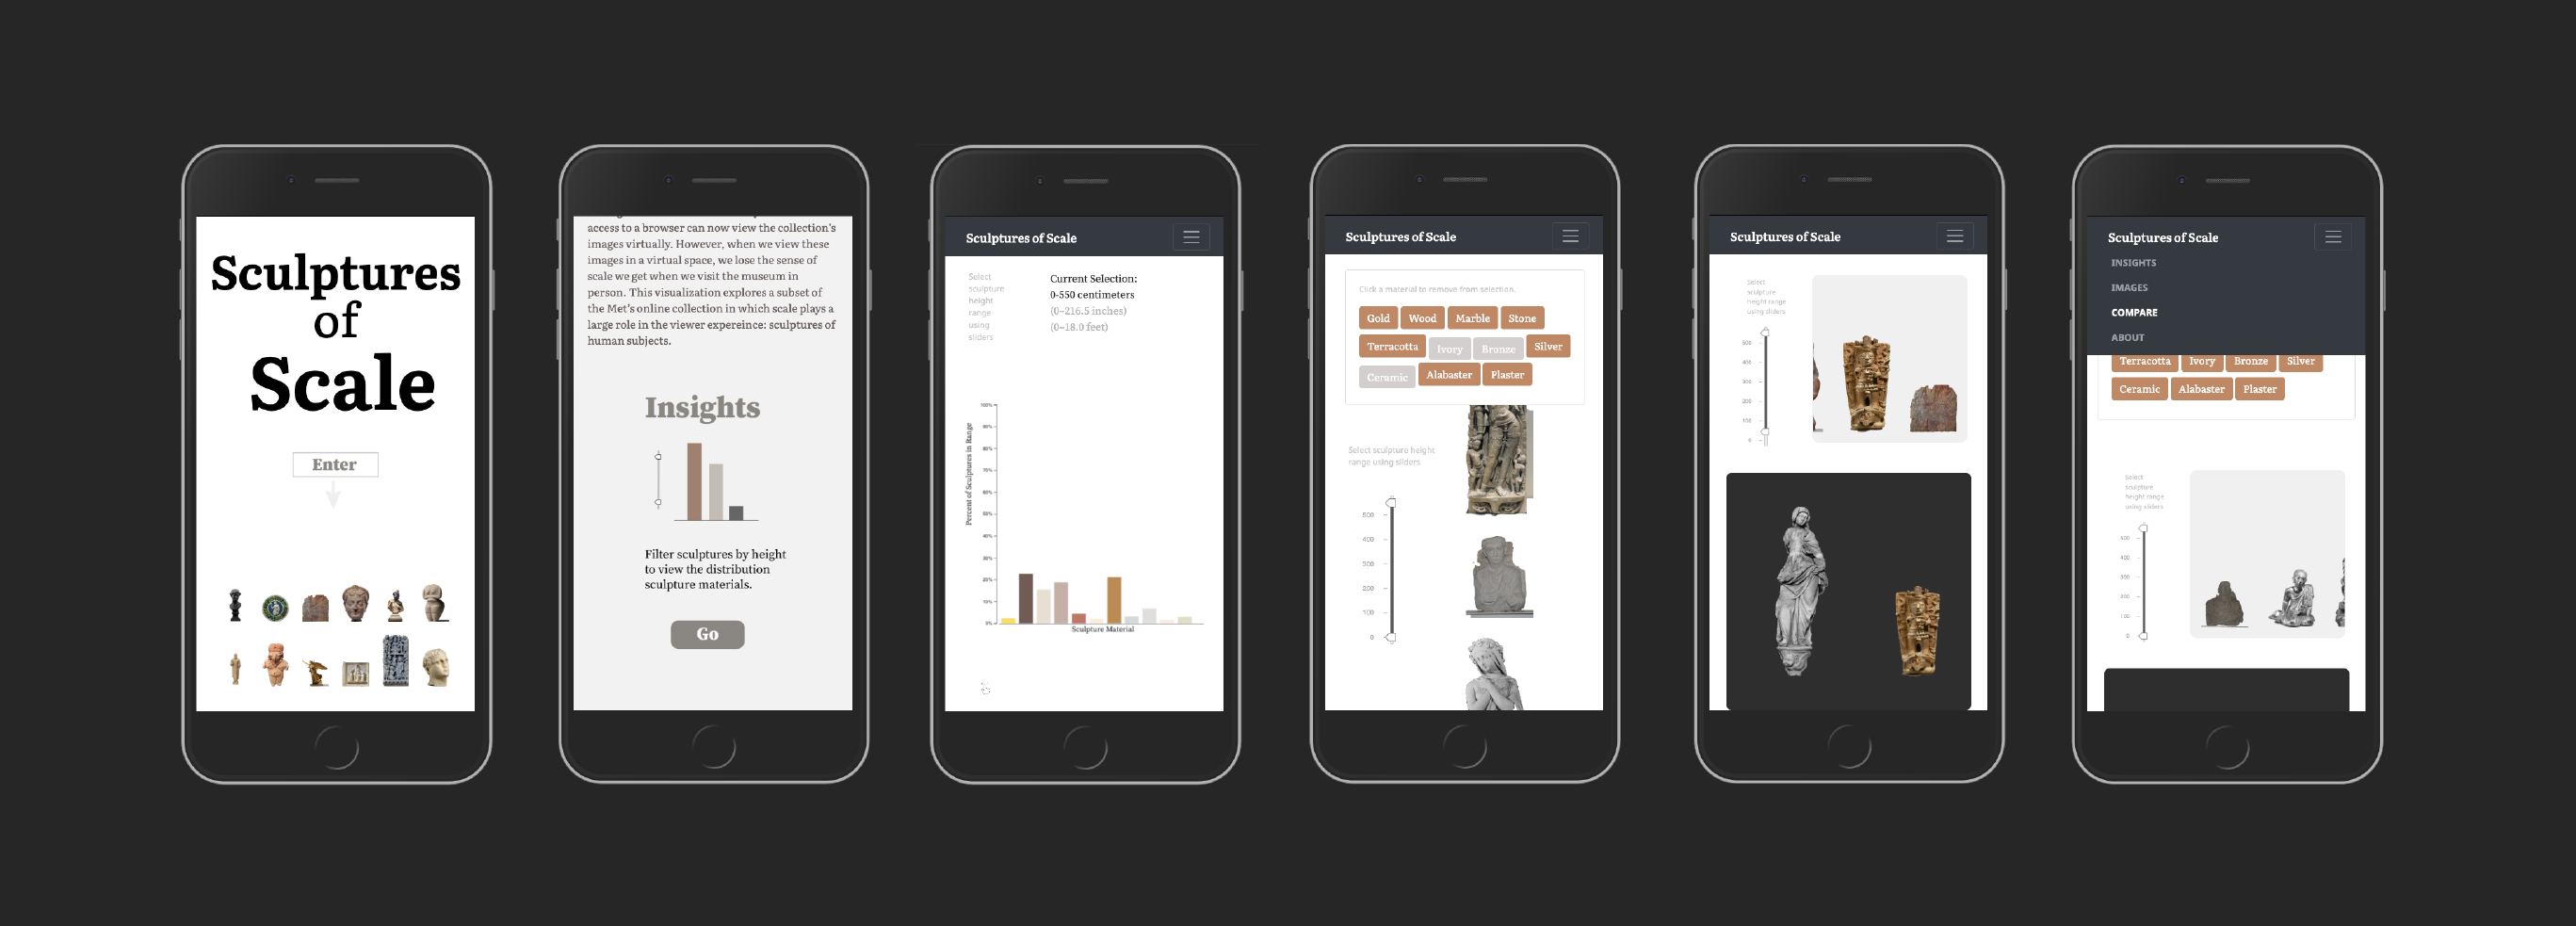
Mobile site walkthrough
Notes on process: these visualizations were created using the following languages, libraries, and tools – javascript & JQuery, D3, opencv & python, d3-simple-slider.js, blowup.js, and Bootstrap css.